
Interpreting Charts & Graphs Format
6 Useful Tips:
- If you are doing an exam task, read the instructions and make sure you write according to the word and time limit.
- Start by saying what the charts show. In an exam, change the words in the question to write the first sentence of your answer, e.g. These charts show, illustrates, demonstrates, portrays, reveals, highlights, represents, explains, exposes.
- The paragraph should provide an overview of the key features of the information. It should describe the patterns or trends in more detail. However, only select the most important ones to write about, and don’t write about your own ideas or opinions.
*Simply write what you see in the chart. - Write no less than three paragraphs:
- Title
- P1 Introduction (1-3 sentences)
- P2 Body (3-5 sentences)
- P3 Closing (2-3 sentences)
- Use linking words and a range of vocabulary to describe what you see in the charts. (You can write percent or %, degrees or ℃ but be consistent.)
- Be careful to use the correct tenses to describe the time periods shown.
Sample
Q. Interpret the chart below. [5]
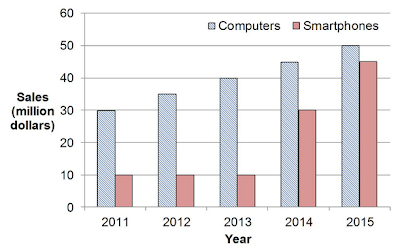
Sales of Computers and Smartphones
The bar graph gives information about how much money was spent on computers and smartphones from 2011 to 2015.
According to the chart, there were upward trends in spending on both items. Computer sales increased steadily from 30 million dollars in 2011 to 50 million dollars in 2015. Each year there was a $5 increase. Smartphone sales remained at 10 million from 2011 to 2013. Then it dramatically tripled in 2014 to 30 million. In 2015, smartphone sales increased to 45 million dollars.
Overall, the sales of both these items grew significantly, but smartphone sales grew more drastically. If this trend continues, we can expect smartphone sales to overtake computer sales in 2016.